Visualization Tools in Axon SDK
Axon SDK provides two key visualization tools to understand spiking behavior and network topology:
- Chronogram Plotting — for spike timing and voltage trace analysis
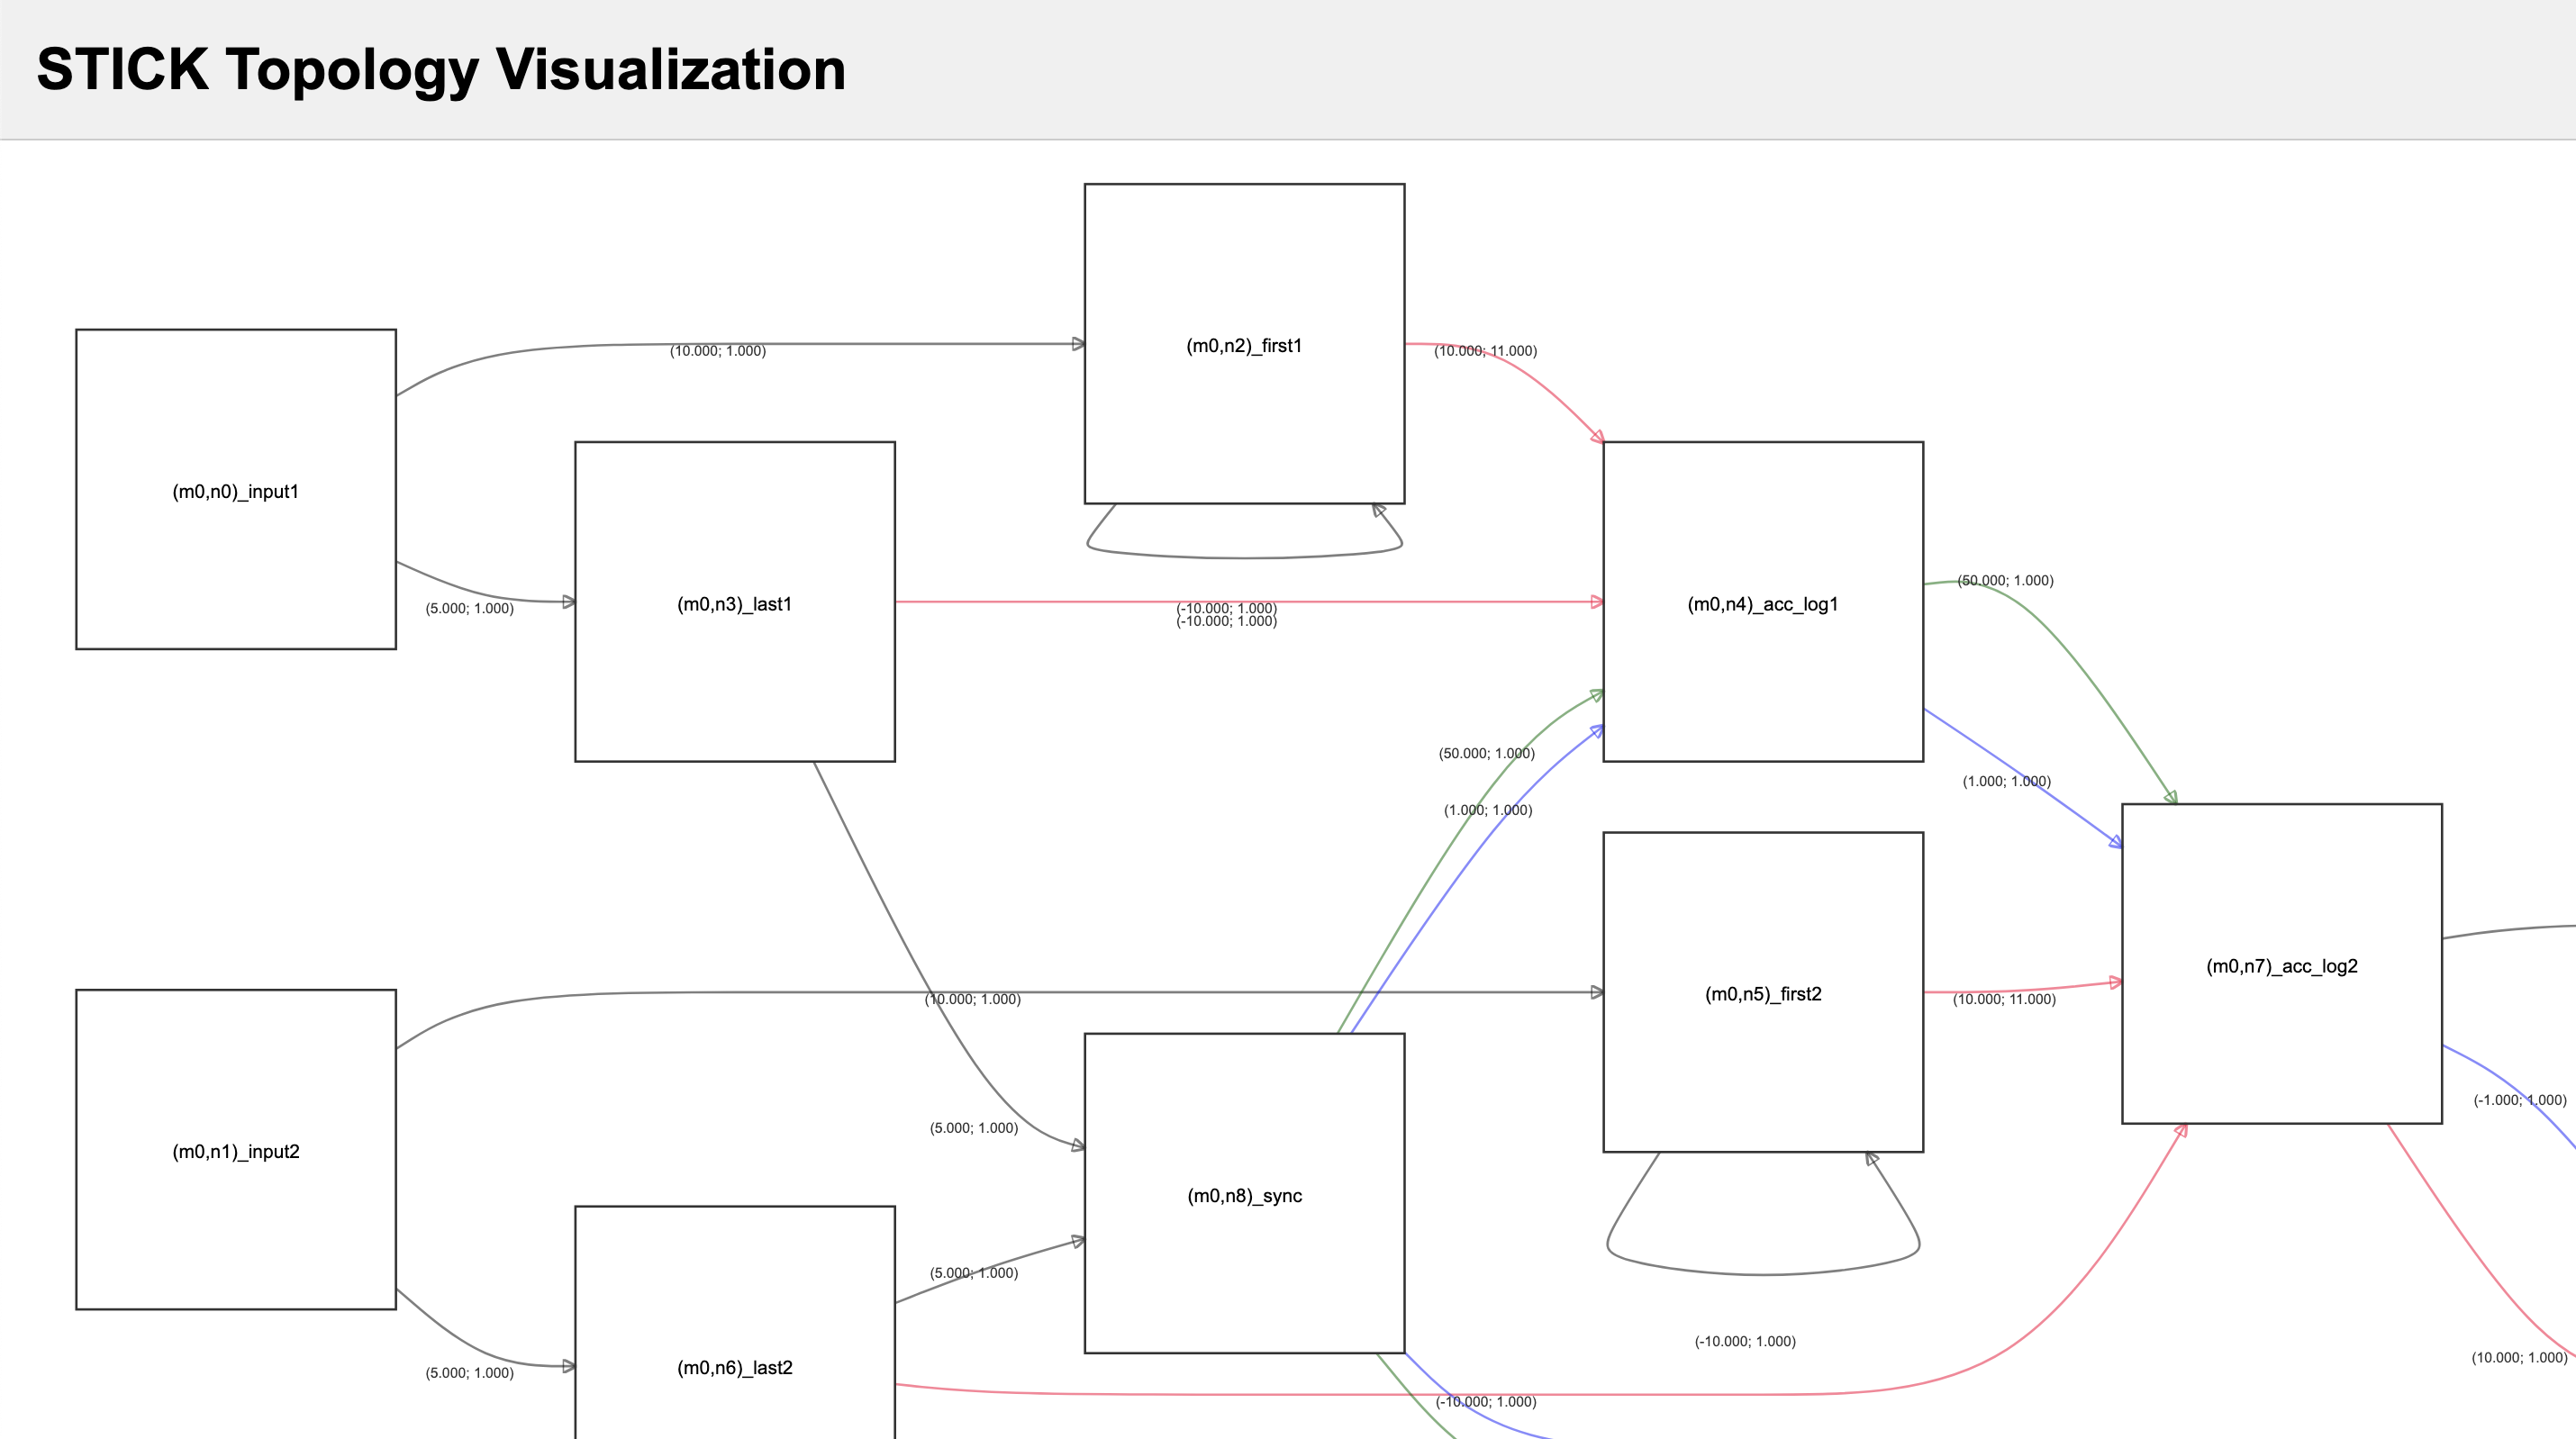
- Interactive Topology Viewer — for structural exploration of STICK modules
These tools help debug and inspect both timing dynamics and network architecture.
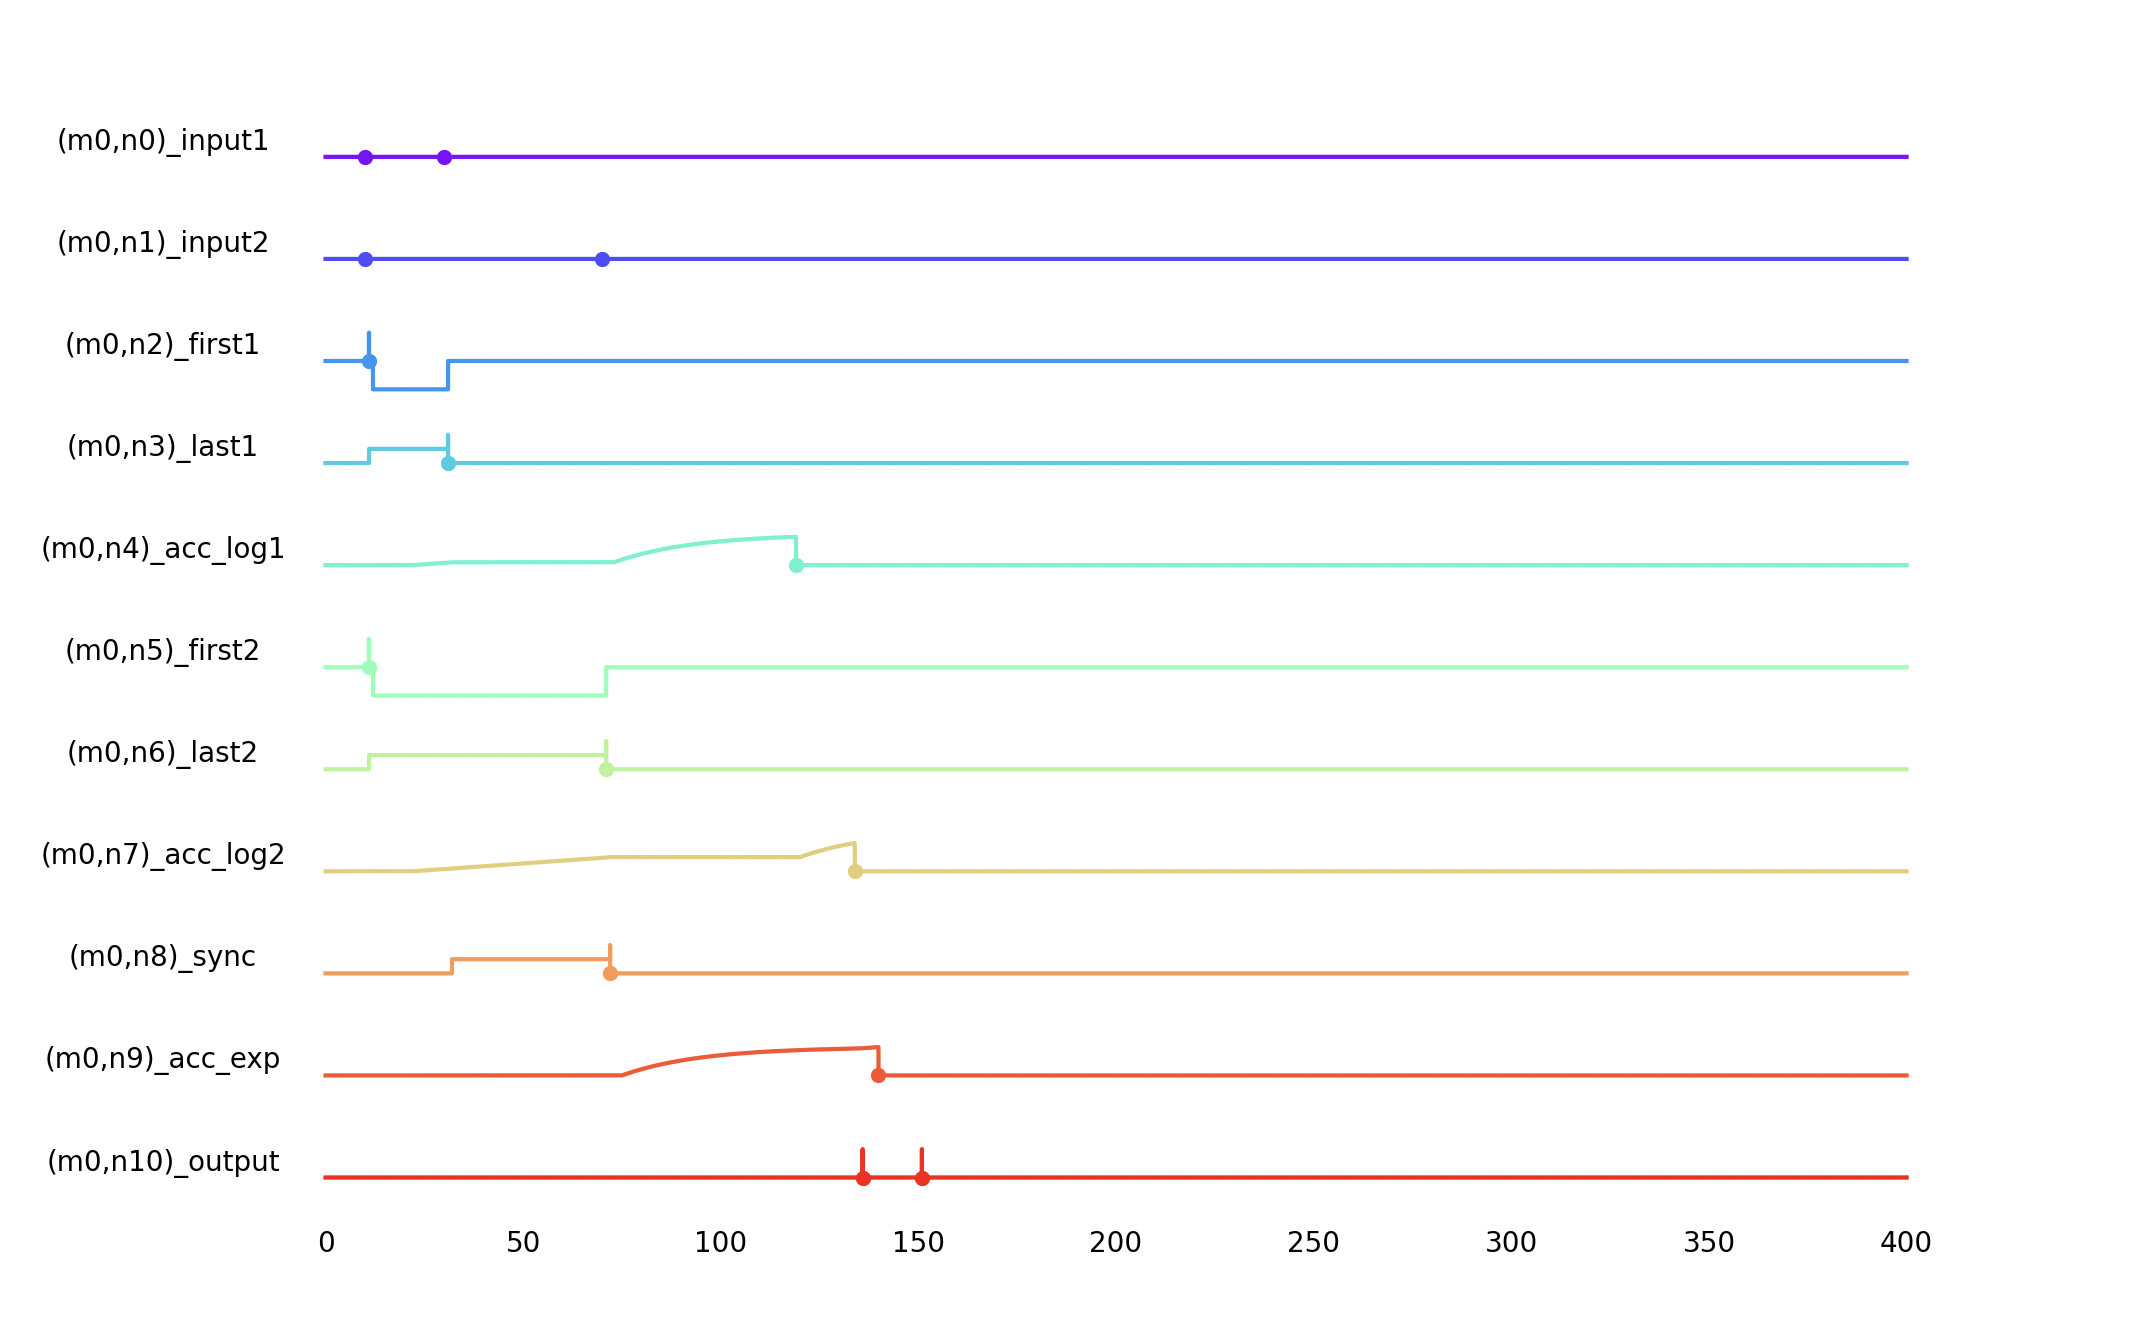
1. Chronogram Plot (chronogram.py)
This tool visualizes the membrane voltage evolution and spike times across all neurons over time.
Key Functions
plot_chronogram(timesteps, voltage_log, spike_log)
- Draws voltage traces for each neuron
- Displays spike events as scatter points
- Labels neurons with their
uid(and optional metadata)
Each subplot shows:
V(t)trace of a neuron- Red dots for emitted spikes
- Gray gridlines and minimal axis clutter
An example plot might look like this:
build_array(length, entry_points, fill_method='ffill')
Used to convert sparse voltage logs into dense time-series arrays using forward-fill or zero-fill.
Example Use
sim.plot_chronogram()
Here is the resulting chronogram plot:
Example Workflow
from axon_sdk.visualization import vis_topology, plot_chronogram

# Visualize network architecture
vis_topology(my_stick_network)

# After simulating
sim.plot_chronogram()